Animated Chart Templates — Bar Chart Race, Line, Pie
Paste your numbers and the chart does the rest. The bar chart race grows and reorders its bars period by period with the date ticking in the corner, the line chart draws itself with a dot that reads out the value, and the pie or donut works out the percentages from «label | value» lines.
There is also a Sankey-style flow that splits a total into its destinations, a dot grid that makes «3 in 10» tangible, poll results with percentage bars and reaction percentages with emoji. Everything is calculated from the data you type, so changing a number updates the whole animation.
8 templates · 16:9 · 9:16 · 1:1Open them in the library
Step-by-step guide: How to make a bar chart race video
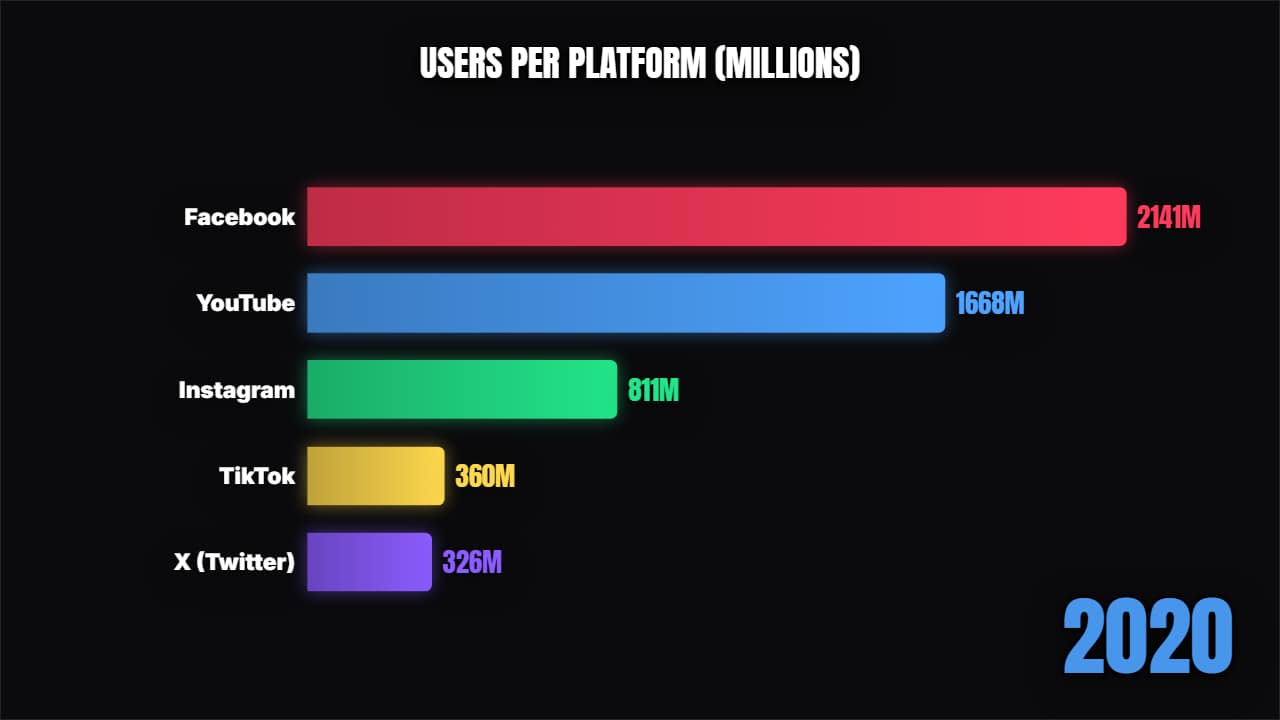 Bar chart raceA proper bar chart race: the bars grow and swap places period by period, with the year counting.
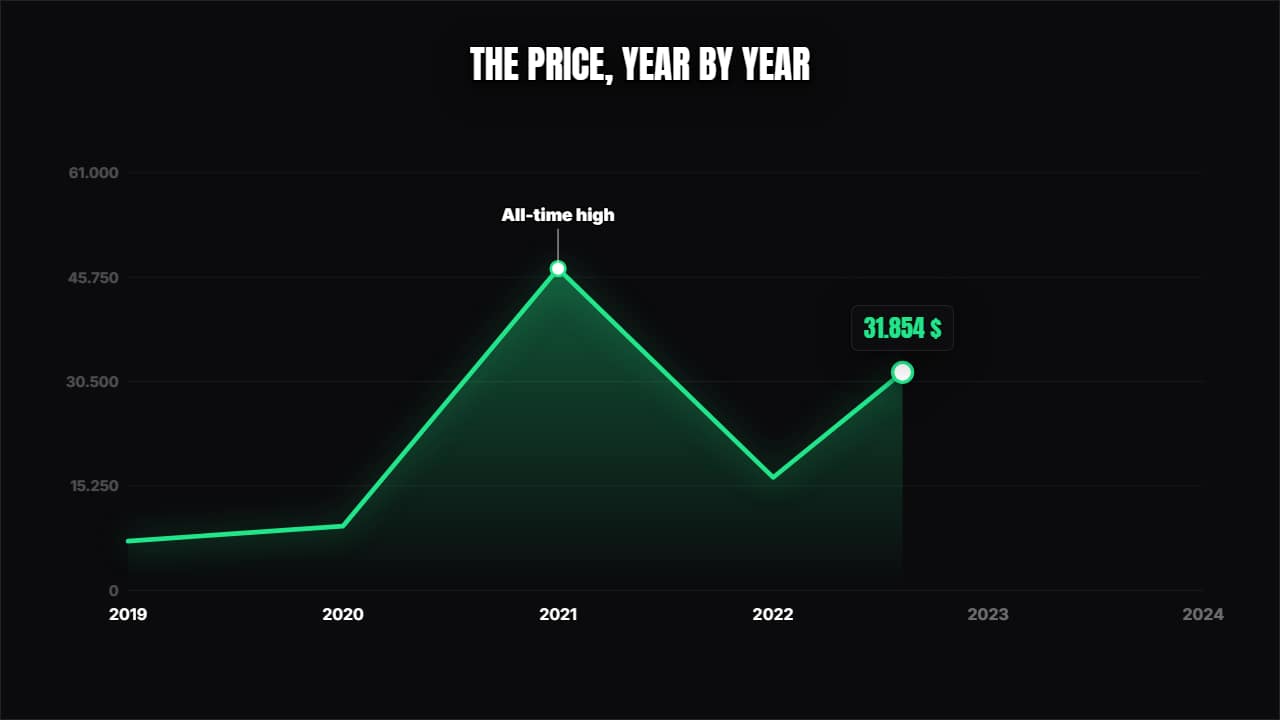 Line chartThe curve draws itself over its axes, a dot travels along showing the value and the annotations pop at the…
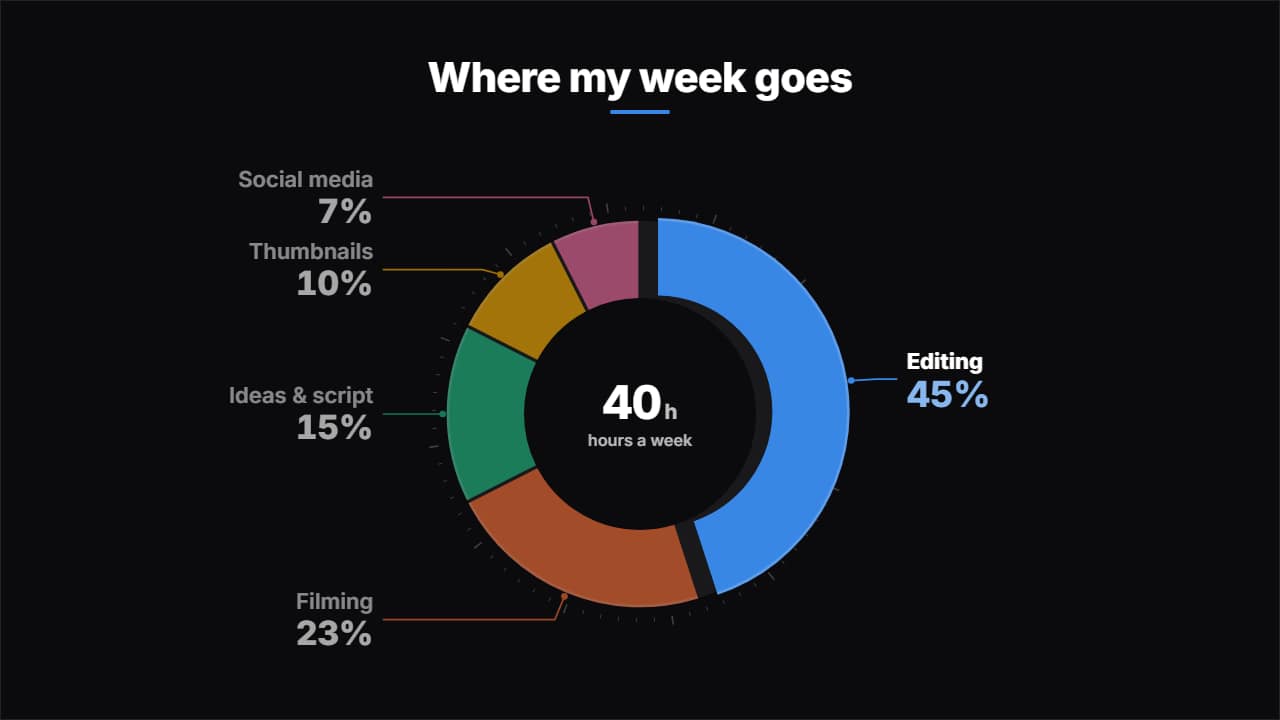 Pie / donut chartType «label | value» per line and the percentages work themselves out (rounded so they add up to 100).
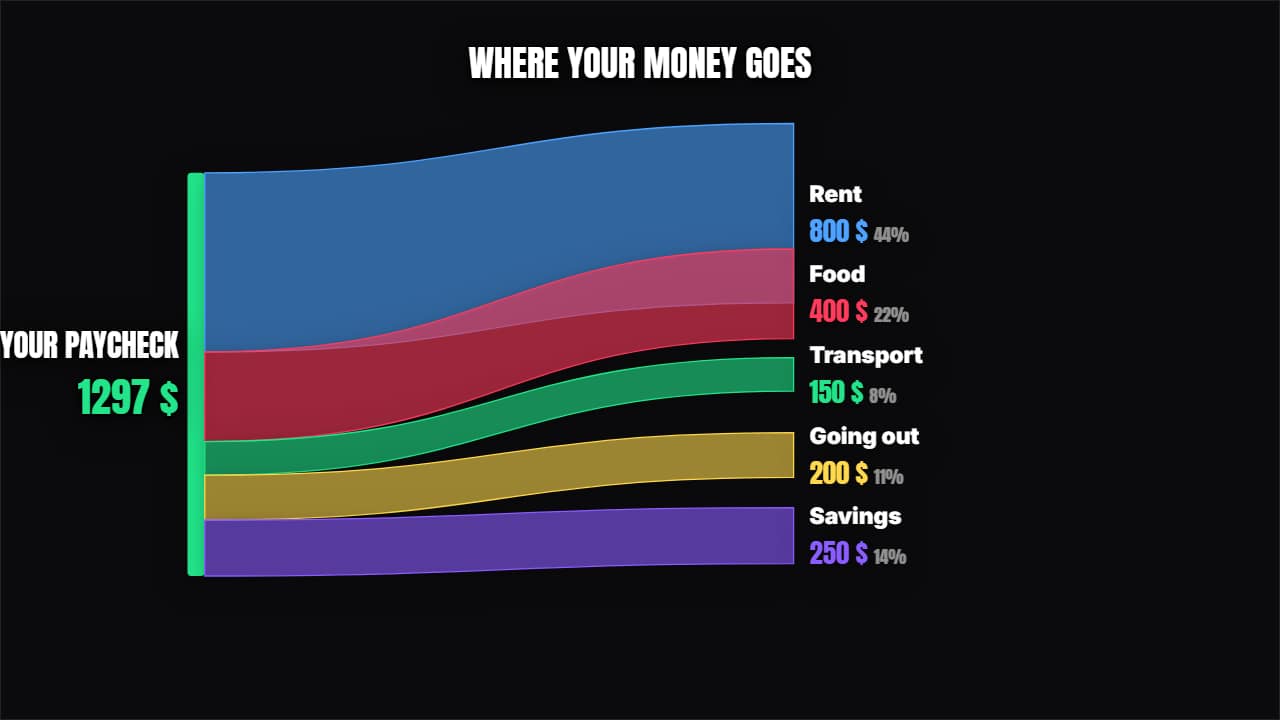 Where it comes from and where it goesRibbons of proportional thickness splitting the total between its destinations, with each one's percentage.
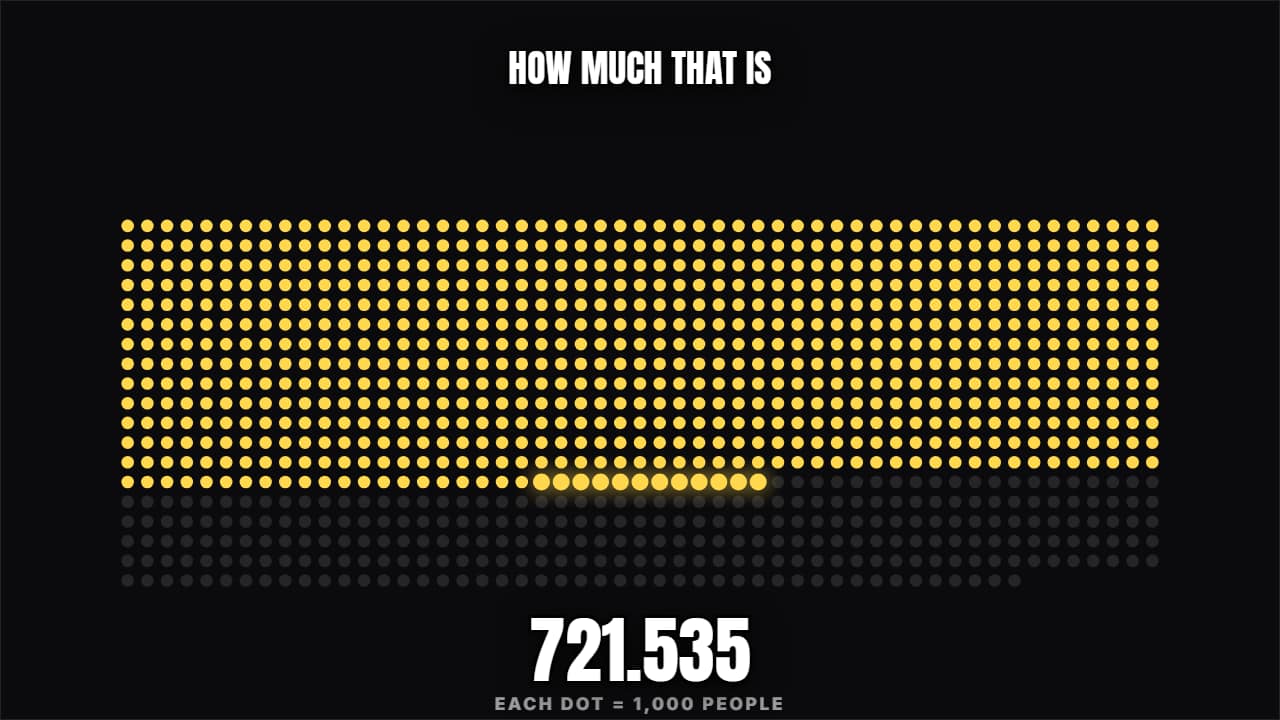 How much is that reallyA grid filling with dots (or people) until the figure genuinely lands. "3 in 10" or "this is a million".
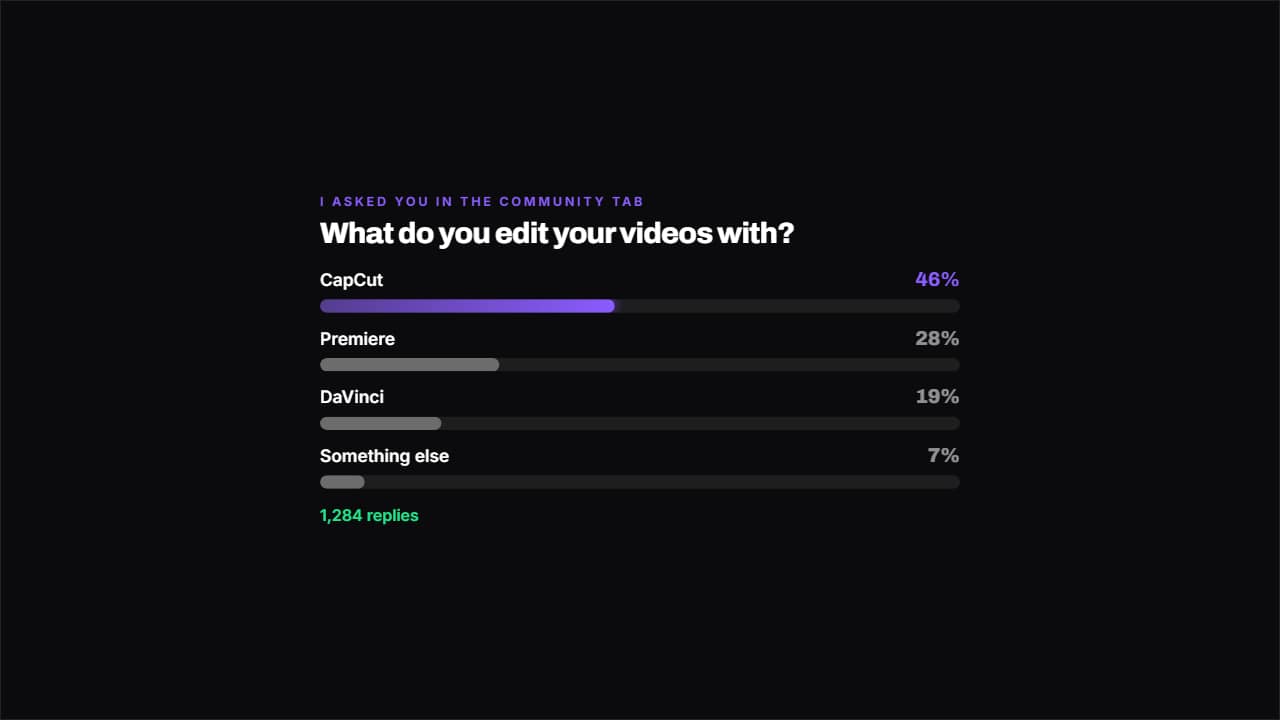 Poll resultThe bars fill with each option's percentage and the most voted one keeps the color.
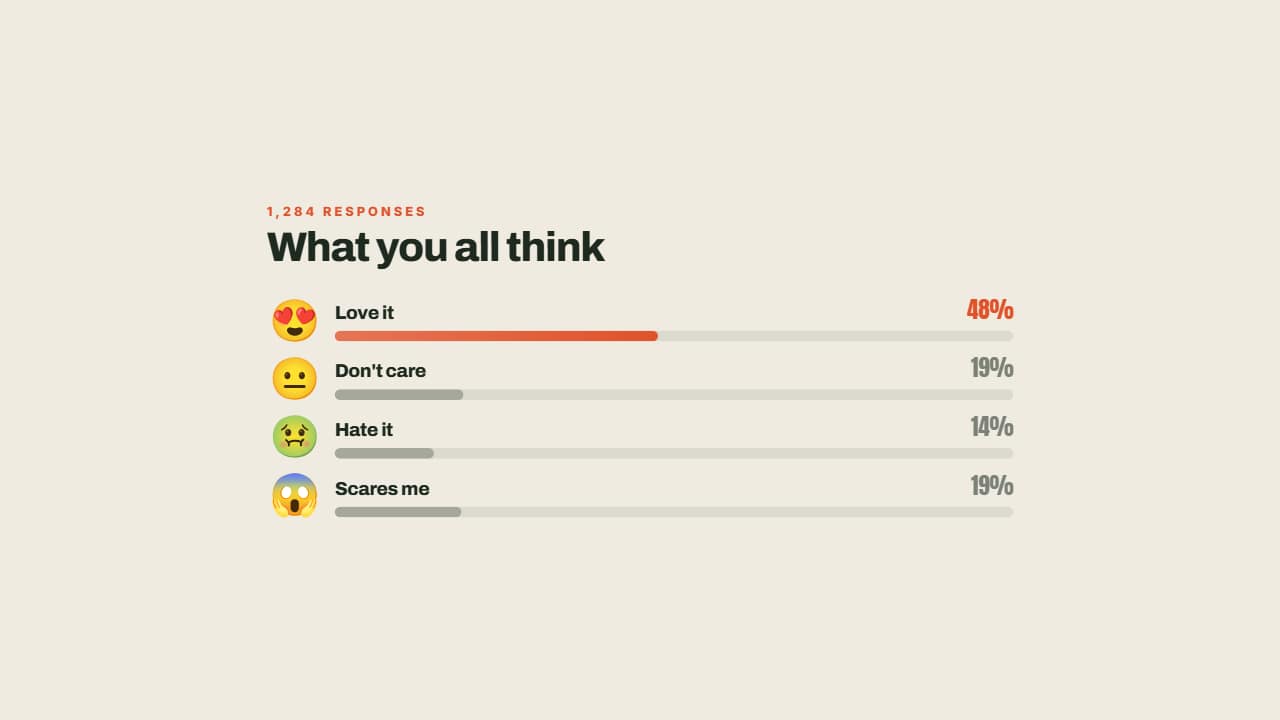 Reactions in percentagesEach reaction with its face, its bar growing and its percentage worked out from the total: you type the raw…
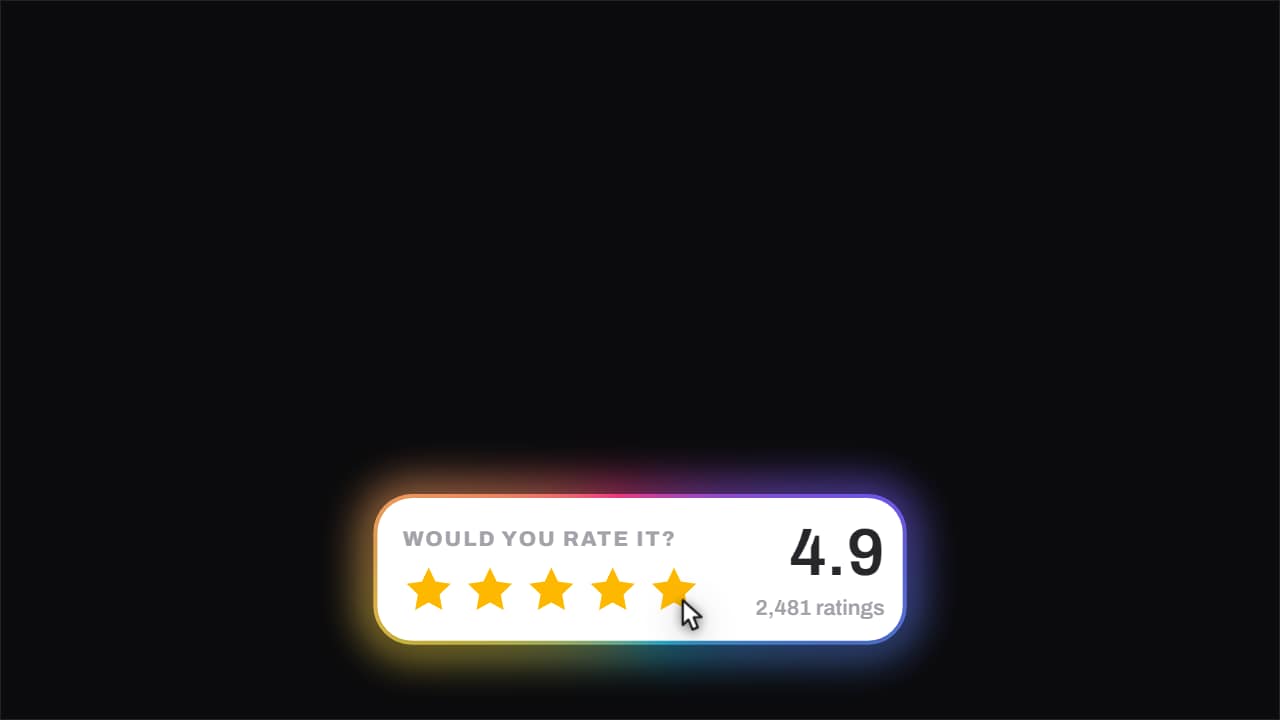 Stars · they fill under the cursorThe stars fill one at a time with the cursor riding across them, and when it ends the score rolls up to its…
Questions
- How do I enter the data for a bar chart race?
- In a table: one row per competitor and one column per period, with the period written above each cell. You can paste a list of periods and the table follows it.
- Do I need to calculate percentages myself?
- No. The pie chart, the poll and the reaction bars work them out from the values you type, rounded so they add up to 100.
- Do I need After Effects?
- No. Every template is edited in your browser: type your text, choose colors and format (16:9, 9:16 or 1:1), watch the live preview and export.
- What do I export, and does it work in my editor?
- Most templates export as a ProRes 4444 .mov with a transparent background, which you place on a track above your clip in CapCut, Premiere Pro, DaVinci Resolve or Final Cut Pro. You can also export an MP4 with your own clip behind it. Always in Full HD.
- Is it free?
- Editing and previewing are free and need no account. To export you sign in with Google; during the open beta, new accounts get export credits at no cost.