How to make a bar chart race video without coding
15 min · 6 steps
A bar chart race shows how a ranking changes over time: the bars grow, overtake each other and the year ticks up in the corner. They do well on YouTube because the whole story fits in a minute and people keep watching to see who wins.
The usual ways to make one are writing Python code or animating it by hand in After Effects. This guide uses a spreadsheet and a browser instead. If your data is already in Google Sheets or Excel, you can have a finished video in about fifteen minutes.
The short answer
Put your data in a table with one row per name and one column per year. Copy it from Google Sheets or Excel, paste it into the free bar chart race maker, open the template in the editor to set the title, the unit and the length, and export a Full HD MP4 (or a transparent .mov) to finish in CapCut, Premiere Pro or DaVinci Resolve.
Try it now: Bar chart race maker (free)
Paste your own numbers and watch a bar chart race and four ranking templates play with them.
What you need
- Your data in Google Sheets, Excel or as plain text.
- Up to 12 names and 12 periods (years, months or seasons).
- An AnimateMyVideo account to download the video (you sign in with Google).
- Any video editor, for the voiceover and the music.
The templates in this guide
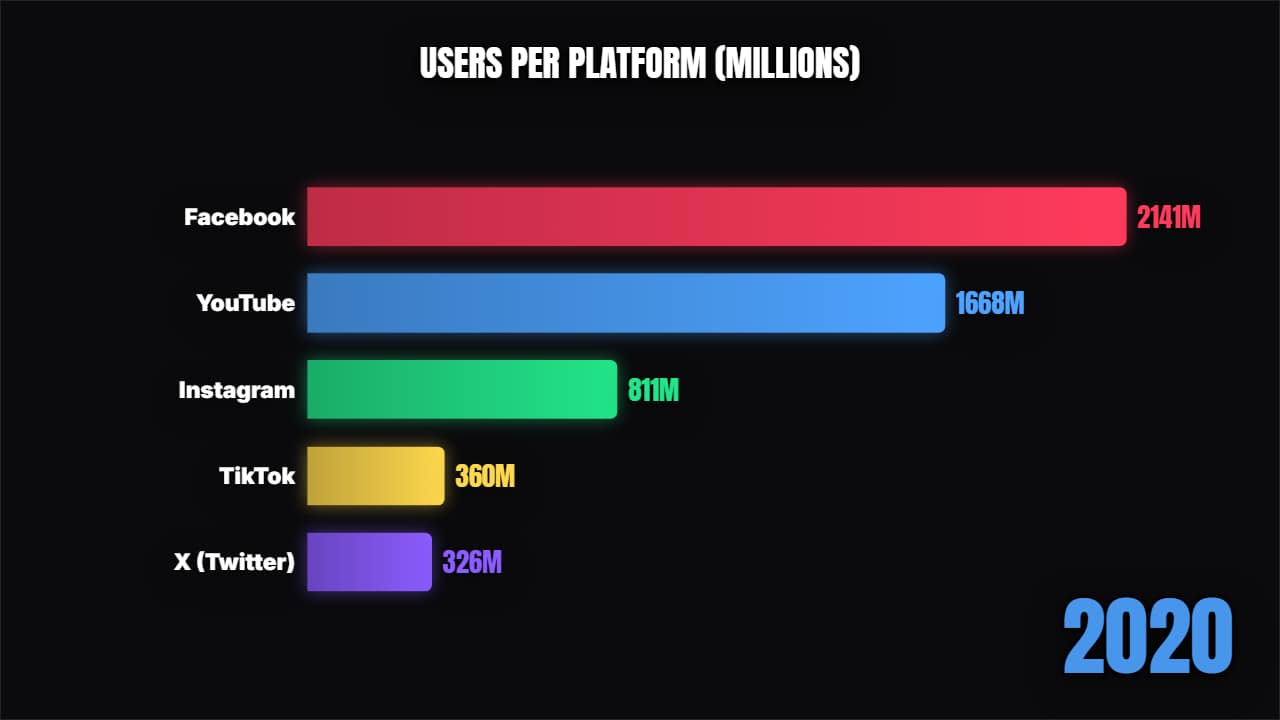 Bar chart raceA proper bar chart race: the bars grow and swap places period by period, with the year counting.
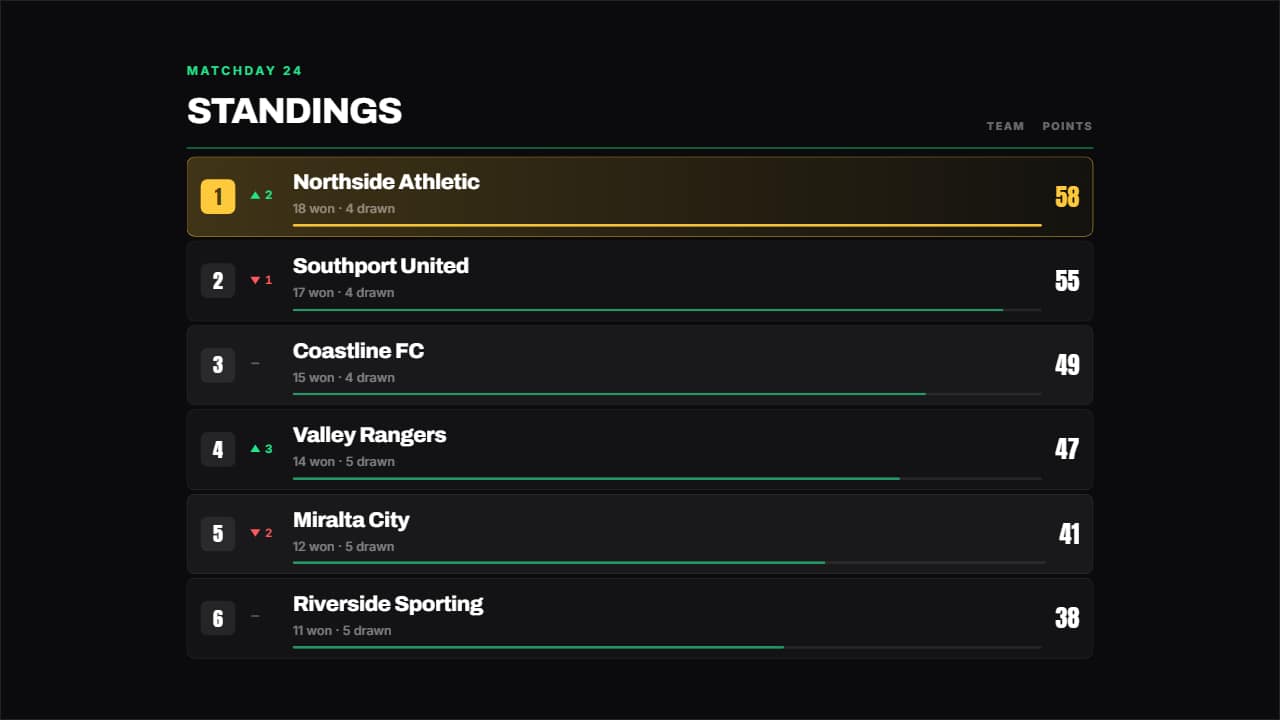 League tableA league table: place, up or down arrow, name, a bar in proportion to the figure and the number counting.
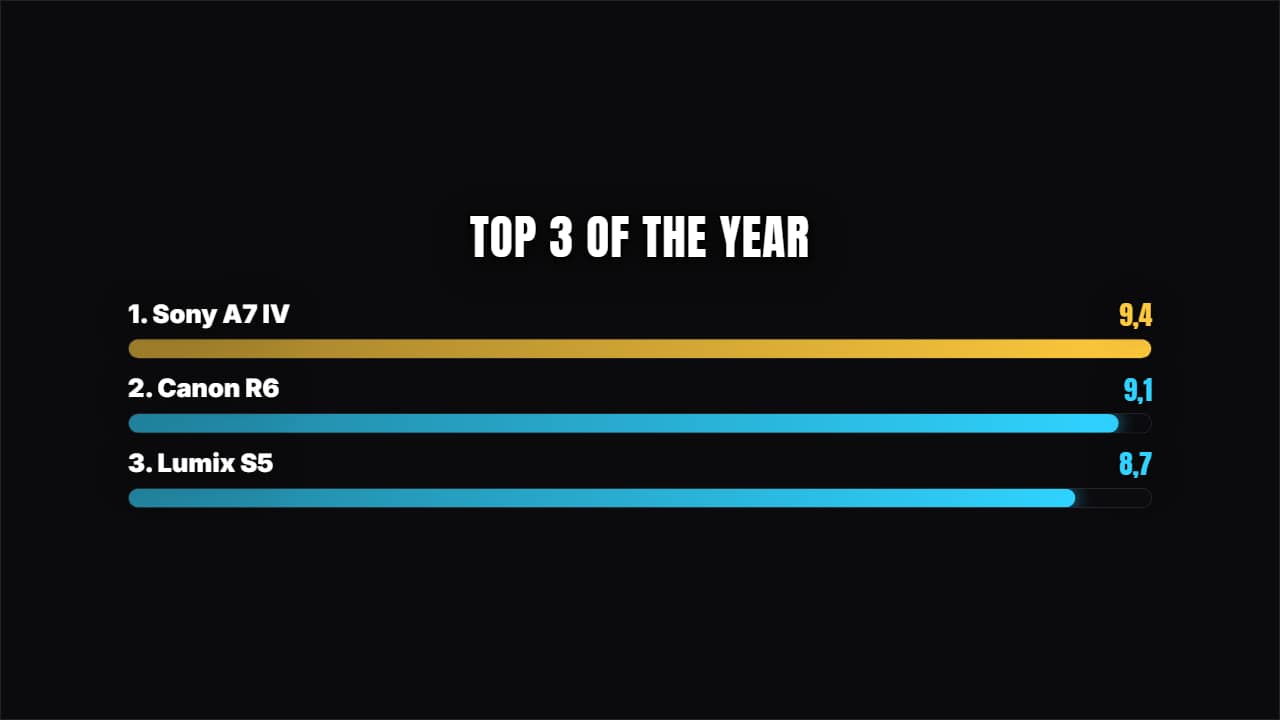 Racing barsHorizontal bars growing with their value counting. For comparing 4, 5 or 6 things at a glance.
Step by step
Step 1: Shape your data as a table
Put the periods across the first row and the names down the first column, one value per cell. For example: a first row with 2000, 2005, 2010, 2015 and 2020, then one row per country with its value for each year.
Every value should use the same unit: all in millions, or all in percent. Write plain numbers (2700, not «2.7K») and keep the unit for later. The race rounds to whole numbers, so if your values are small decimals like 1.25, scale them up first or round them.
Step 2: Paste it into the bar chart race maker
Select the cells in your sheet, including the header row and the names, copy them and paste them into the box in the free bar chart race maker. Comma-separated text works too, one line per name. The race starts moving right away, together with four ranking templates (a top 5 countdown, a league table, racing bars and a podium) that use the values of your last period.
Step 3: Check the story before you style it
Watch the preview to the end. A good race has at least one overtake. If the order never changes, a ranking or a podium of the final year tells the same story in less time. Remove rows that never get near the top: fewer bars read better on a phone.
Step 4: Customize it in the editor
Click «Customize & export» under the race. The editor opens with your table already in it. Set the title, the unit (M, %, km) in its own field, how many bars are visible at once, the accent color and the format: 16:9 for YouTube, 9:16 for Shorts.
Then set the length. Around three to five seconds per period keeps it readable without dragging, so six periods make a race of 20 to 30 seconds.
Step 5: Choose the background and export
Pick how you want the file, then click Export and sign in with Google to download. During the open beta, new accounts get export credits at no cost.
- With a background: a normal MP4 with the chart full screen. The usual choice for a bar chart race video.
- No background: a transparent .mov (ProRes 4444), to put the chart over your own footage or a talking head.
- On my video: upload your clip and get the chart already placed on it, as an MP4.
Step 6: Finish it in your editor
Add your voiceover and music under the chart, and credit your data source on screen or in the description: viewers do ask.
- CapCut: Import the MP4 and put it on the main track, with the music and voiceover on the audio tracks below.
- Premiere Pro: File → Import, then drag it into your sequence. A transparent .mov goes on V2, above your footage on V1.
- DaVinci Resolve: Import it into the Media Pool and drag it to the timeline. If a transparent .mov shows black, right-click it and set Clip Attributes → Alpha Mode to Premultiplied.
Tips for a race people watch to the end
Put the question in the title: «Most popular programming languages, 2004–2024» tells the viewer what to watch for. Keep 8 to 12 items; with more, the labels get too small on a phone. Talk over the overtakes, not over the steady parts. And hold the final ranking for a second or two so people can read it: a lot of viewers pause on the last frame.
Other ways to make one, and when they're better
If you have thousands of rows or need to update the chart every week, code is the better tool: Python libraries such as bar_chart_race build one from a CSV file. Web chart tools are great for interactive charts that live on a website. After Effects gives you full control if you already know it. For a YouTube video made from a small table, a template saves you the setup.
Questions
- Can I make a bar chart race for YouTube Shorts?
- Yes. Choose 9:16 in the editor and keep the names short so they fit on a phone screen.
- How long should a bar chart race video be?
- Most work best between 20 seconds and 2 minutes. Count roughly three to five seconds per period, and drop the periods where nothing changes.
- Where can I find data for a bar chart race?
- Public sources such as Our World in Data, the World Bank, national statistics offices and sports reference sites publish yearly tables you can copy into a sheet. Check the license and credit the source.
- Is the bar chart race maker free?
- Pasting your data and watching the previews is free and needs no account. To download you sign in with Google; during the open beta, new accounts get export credits at no cost.
Try it now: Bar chart race maker (free)
Paste your own numbers and watch a bar chart race and four ranking templates play with them.